You're funding the wrong partnerships. Here's how to tell.
Import partners, customers and the delivery work between them. Day one shows what's missing and where to focus. As the data grows, it shows which relationships keep customers — and which just look busy.
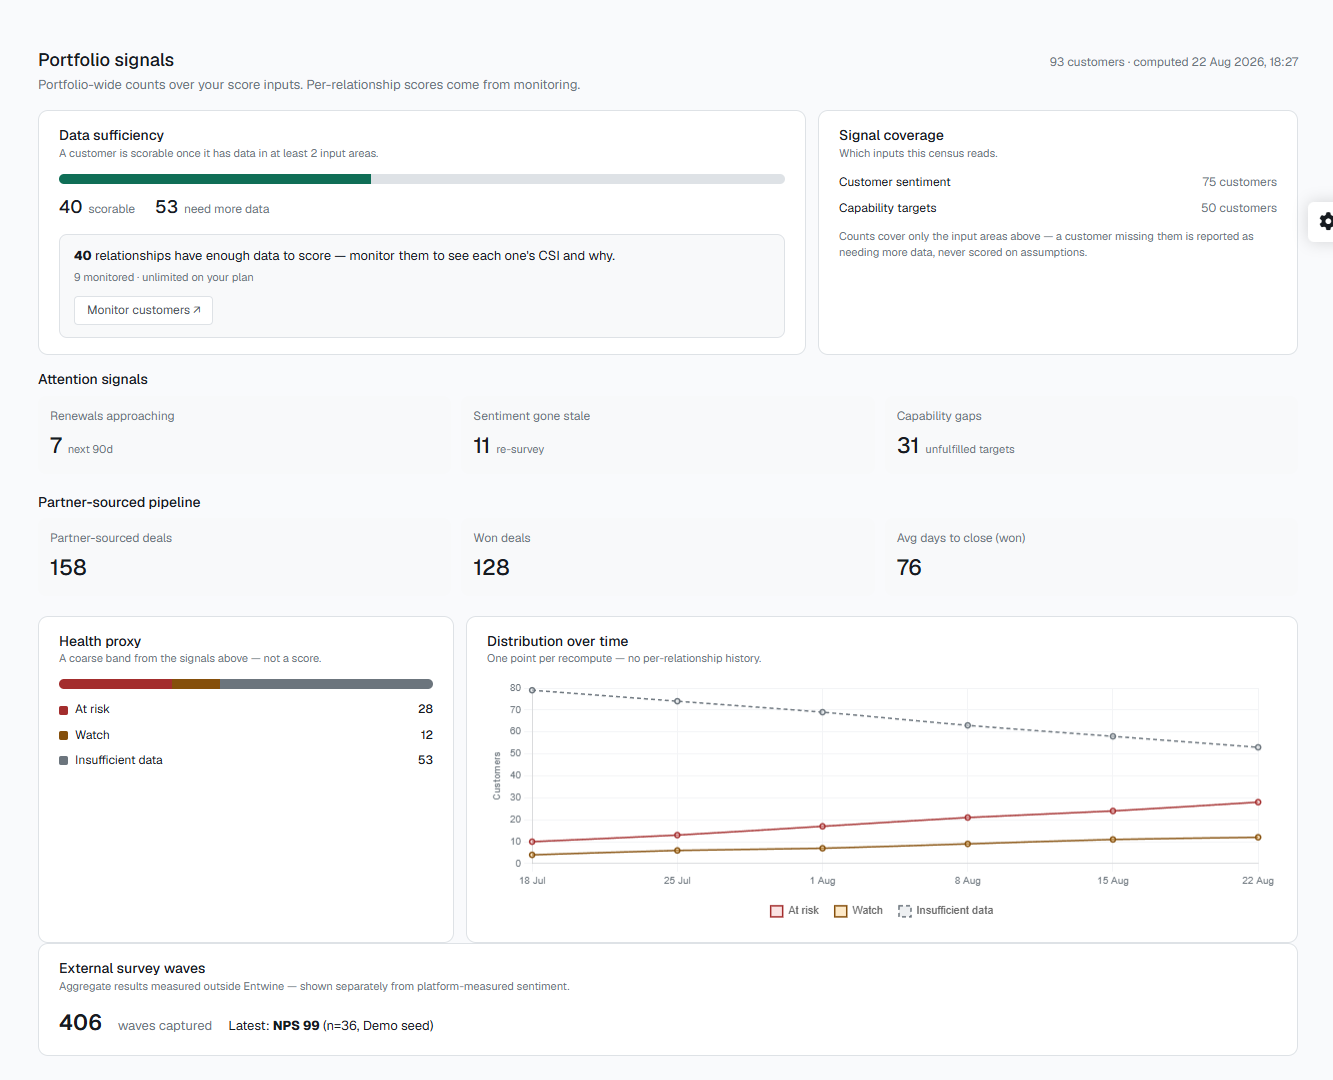
Counting partners is easy. Knowing which ones keep customers is not.
Referrals get counted, so they get the budget. The partners who keep customers renewing live in spreadsheets and CRMs built for pipeline, where nobody counts them. The four depths show how far apart the two can get.
From spreadsheet to intelligence in three steps.
Import your ecosystem
CSV or Excel, with flexible mapping. Partners, customers and the delivery relationships between them.
See what you actually have
Counts, concentration, coverage gaps, and the relationships too data-poor to score yet — shown honestly, not smoothed over.
Watch intelligence emerge
Monitor the relationships that matter: health, sentiment, renewals — and, ultimately, which parties produced each customer's outcome.
Four measures and one attribution layer — all read at the customer.
Measure at the customer. Attribute across the ecosystem. Every measure is role-neutral: nothing in the arithmetic distinguishes a partner from a customer — only what each party did, and when.
Customer Discovery Efficiency
How much faster does the ecosystem get a customer from need to the right solution than they would have managed alone?
A ratio; 1.0 means no advantage. median days-to-close, direct ÷ ecosystem-sourced, reported per referral route. Withheld on thin samples — a blank is honest, an estimate is not.
Trust Transfer Index
How much of a referrer's credibility travels with the referral?
win rate of deals referred by a party ÷ win rate of unreferred deals. The referrer can be a partner or a customer — same formula, same axis. It measures conviction, not speed.
Customer Success Index
Is this customer actually succeeding?
The customer's own score, 0–10: product adoption · engagement quality · advocacy · business outcomes · sentiment, weighted over the components that have data. A partner's number is never computed here — it is derived from the health of their customers.
Ecosystem Completeness Score
How much of the customer's recorded needs does the ecosystem meet?
0–100%: needs met by the ecosystem ÷ needs recorded, importance-weighted. Above 80% the ecosystem is a complete solution; the unmet needs are your partner-recruitment brief.
The attribution layer
Which parties produced this customer's outcome, and in what proportion?
A share of 15 weighted points per customer — Acquisition ×1 · Onboarding ×2 · Adoption ×3 · Retention ×4 · Expansion ×3 · Advocacy ×2. A party present only at acquisition can earn at most one point of fifteen: a partner measured purely on pipeline is being judged on roughly one-fifteenth of the value they could create. That arithmetic is the Partnership Paradox, stated precisely.
Deterministic scoring on every tier; a monitored relationship buys the per-relationship score and the reasons behind it. Definitions follow Customer Outcome Intelligence v1.0 — why we built it, in our own words ▸
Free for 5 monitored relationships.
A monitored relationship is one Entwine scores continuously. Users, portal seats and the registry are unlimited and free. Paid tiers are coming soon.
No SOC 2 yet — and we won't imply otherwise. Read the security page ▸
Questions we get asked.
Is this a PRM?
No. PRMs manage partner pipeline; Entwine connects partnerships to customer outcomes. It complements a PRM or CRM rather than replacing one.
What do I need to start?
A CSV. No integrations are required on the Free tier — import your partner list and Entwine shows you what you have.
Is the free tier really free?
Yes: no card, no seat charges, no portal caps. Free for 5 monitored relationships.
What happens when all 5 monitored slots are used?
Nothing is lost. Your registry keeps growing; scoring simply pauses for additional relationships until you free a slot or upgrade.
Where is my data?
Hosted on DigitalOcean in the US, with fail-closed tenant isolation. See the security page for the full picture.
See what's really in your ecosystem — in the next 15 minutes.
- No credit card required
- Free for your whole team
- A CSV is enough to start
Already have an account? Log in
Create your free account
No credit card required
Every new workspace starts on the Free plan — 5 monitored relationships, unlimited users & portal partners. Upgrade in-app whenever you're ready.