The alternate lens · 72-second video

One QBR. Two perspectives.

The same partner quarterly review, assessed from two angles. First as the vendor reads it — what did our partners produce for us? Then as customer success reads it — which relationships create, and keep, the customer's outcome? Same numbers, a different question, and one question the deck cannot answer at all.

Illustrative data 1 min 12 s · on-screen captions, no audio Fictional companies and figures, used to illustrate the pattern.
The two lenses

What changes when you ask a different question

Most quarterly reviews are built to answer one question, usually the vendor's. Ask the customer's question of the same three rows and every verdict turns over, without changing a single number.

Vendor lensPoint of sale
"What did our partners produce for us — and how do we get more volume?"
  • 1,204 introduced"Activation gap — build a sales motion."
  • Retention climbing"Churn isn't the problem."
  • Partner share growing"Cheapest channel — recruit more."
Customer success lensAfter the sale
"Which relationships actually create — and keep — the customer's outcome?"
  • 1,204 introducedNever transacted. The scorecard counts the front door; whether a customer ever reaches first value isn't on it.
  • Retention climbingExactly as the partner-managed share grows. The correlation is the picture.
  • Partner share growingThe network is doing the retaining — and the deck can't see its own driver.
Which partner could re-open the accounts that went quiet? — no data —

Some questions the deck can't answer at all. That silence is the finding. The raw material was sitting in the partner registry all along — a "no activity since May" row nobody read — and the moment the registry is connected to customer data, the same registry answers it.

Three takeaways

Three frames for your next review.

The video keeps its figures illustrative. These are the frames to take into your own quarterly review — the first two use invented numbers; the third is a real, anonymised cohort.
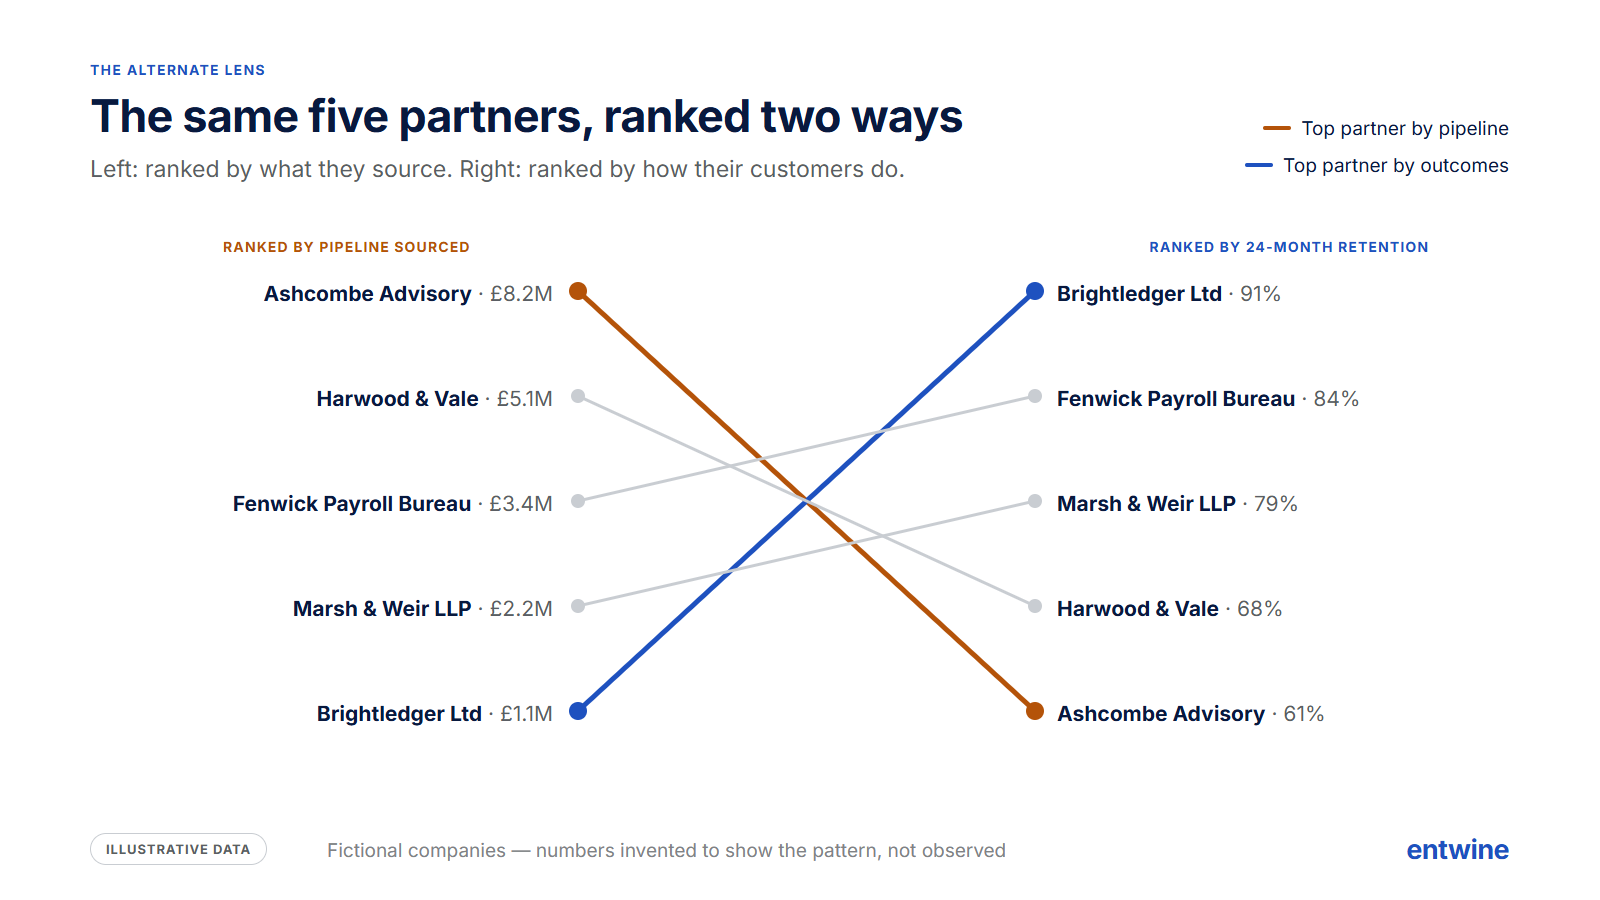
Slopegraph: five partners ranked by pipeline sourced on the left and by 24-month retention on the right; the top partner by pipeline finishes last on retention
The same five partners, ranked two ways. Ranked by what they source, then by how their customers do. The lines cross.
Illustrative data
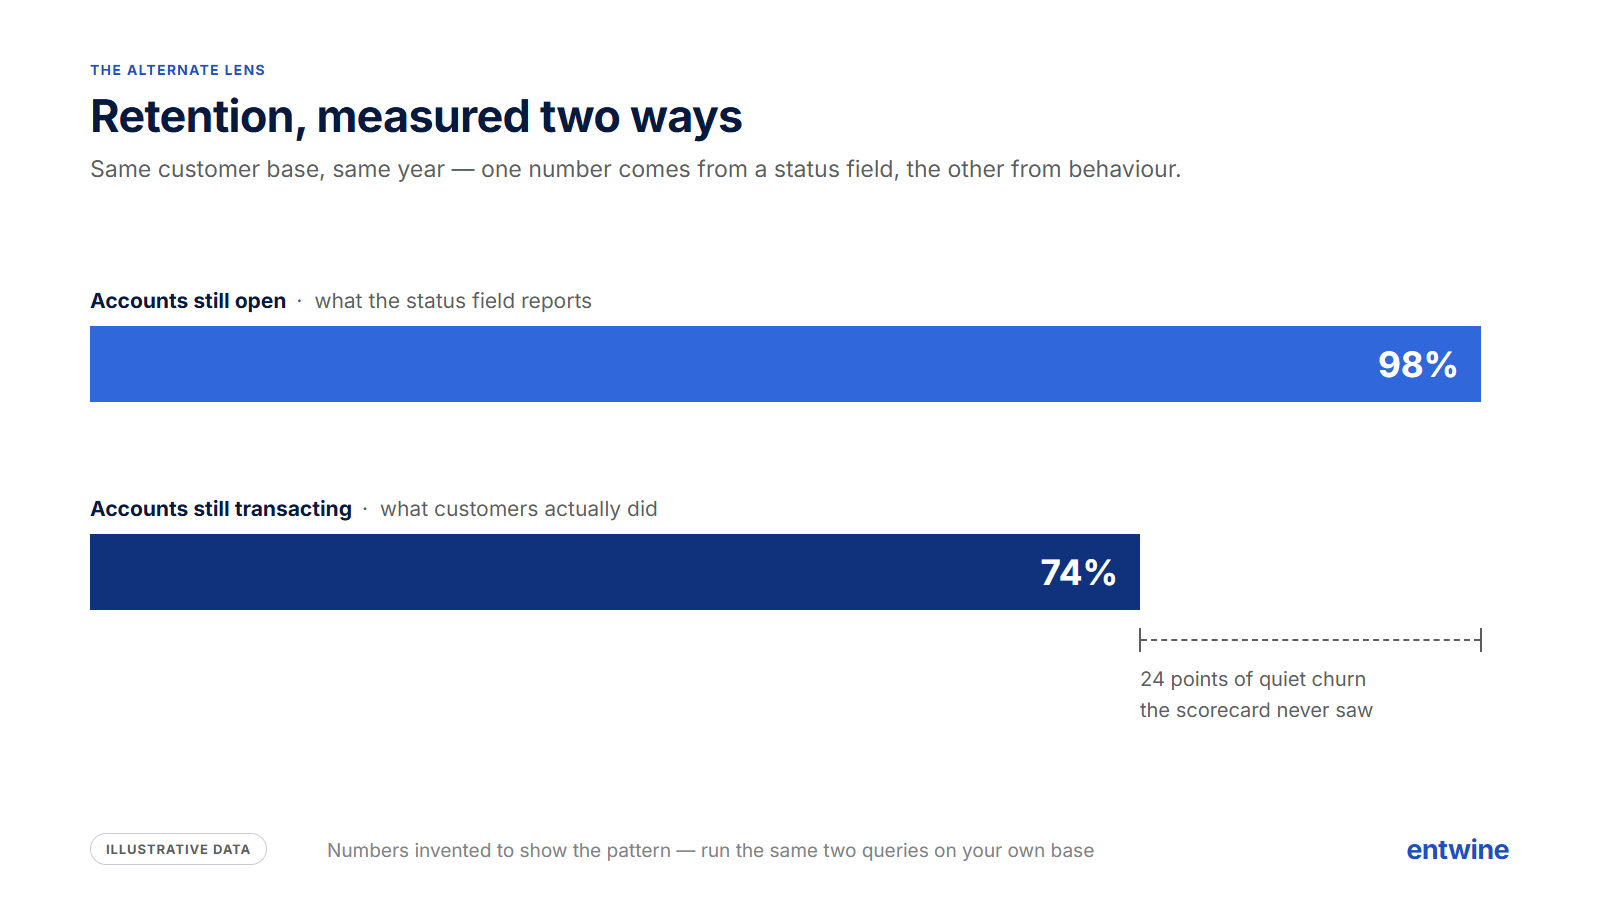
Two bars: 98% of accounts still open by status field versus 74% still transacting by behaviour — 24 points of quiet churn
Retention, measured two ways. One number comes from a status field, the other from behaviour. Run the same two queries on your own base.
Illustrative data
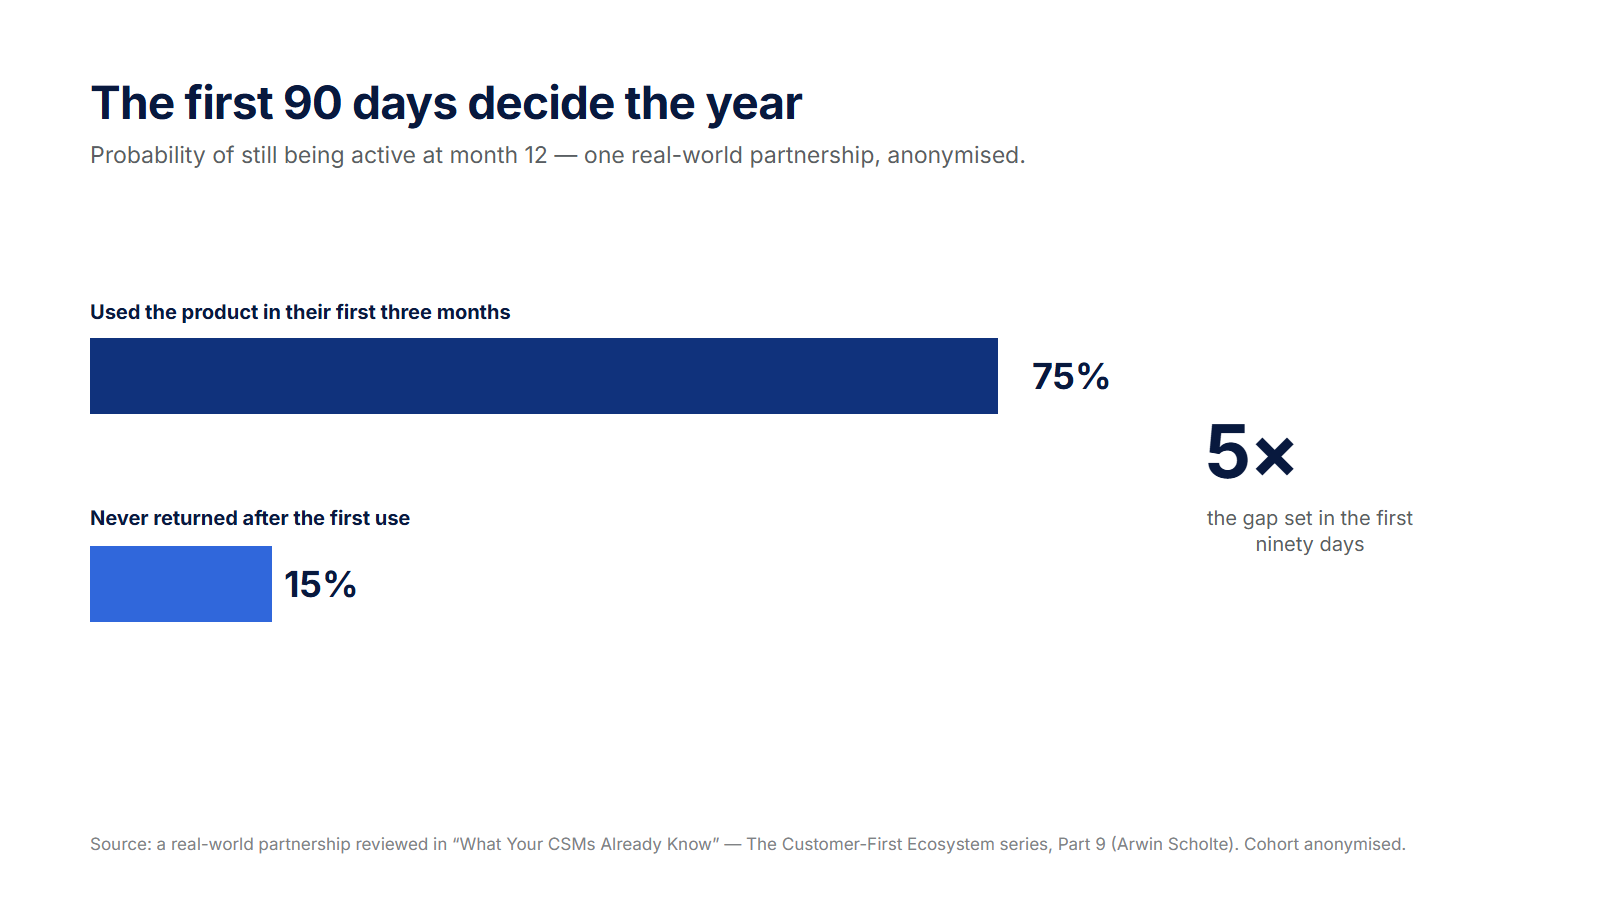
Bar chart: customers who used the product in their first three months are 75% likely to still be active at month 12, versus 15% for those who never returned after the first use — a 5 times gap
The first 90 days decide the year. One real-world partnership, anonymised: a 5× gap in month-12 survival, set in the first ninety days.
Real cohort · Customer-First Ecosystem series, part 9

See your partners from the customer's side.

Import the relationships you already have and see which of them create — and keep — customer outcomes. Free for five monitored relationships.

Get Started Free Start with the readiness check
The missing data layer — the essay behind the video Partnership depth: sell, deploy, run (44-second animation) The four measures, read at the customer